Baltimore Metro
Metro Area Overview
Market Trend Map
Metro Area Overview
Demand for homes in the Baltimore Metro area rose in February according to the Bright MLS | T3 Home Demand Index. The Index, at 80, was 15.9 percent higher over the month and reflected a Slow pace of buyer activity. Compared with one year earlier, the Index was 3.6 percent lower.
The market trend line, below, provides a high-level monthly overview of the Home Demand Index for each of the metro market areas within the Greater Baltimore Metro Area. The Home Demand Index is baselined at 100, with 90-110 indicating a steady market. Index values above 110 indicate moderate and high activity while Index values below 90 indicate slower or limited activity. For more information for a given period of time, click on any point on the map to pull up the monthly report.
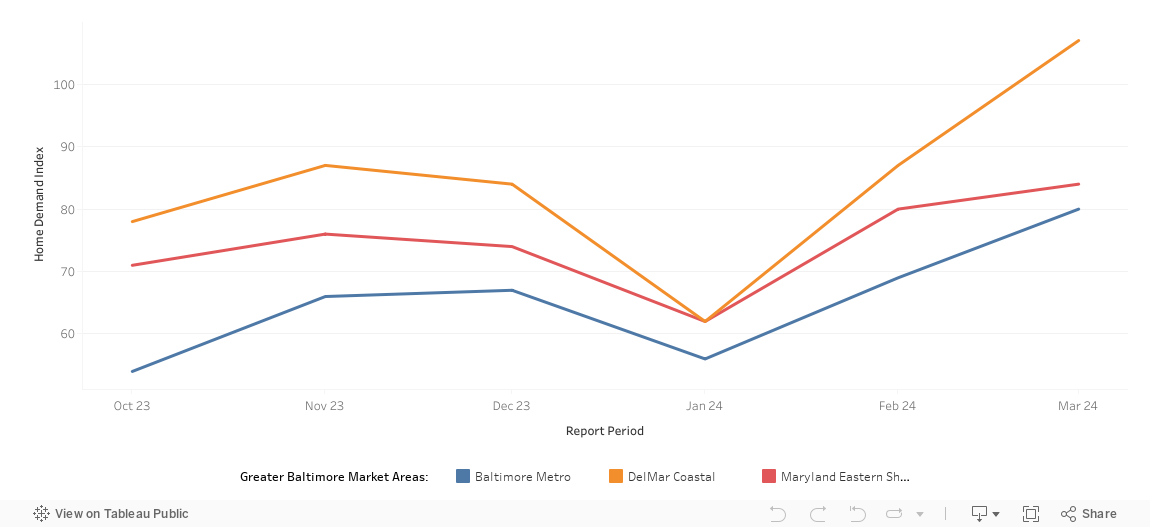
Metro Market Trend Data by Bright MLS | T3 Home Demand Index
Each of the market areas listed above are defined as follows:
- Baltimore Metro – Anne Arundel, MD; Baltimore City, MD; Baltimore, MD; Carroll, MD; Harford, MD; Howard, MD;
- DelMar Coastal – Somerset, MD; Sussex, DE; Wicomico, MD; Worcester, MD;
- Maryland Eastern Shore – Caroline, MD; Cecil, MD; Dorchester, MD; Kent, MD; Queen Annes, MD; Talbot, MD;
Market Trend Map
The Market Trend Map for the Baltimore Metro pulls the county map from the monthly reports and combines to provide a time-lapse of the overall market. Use the navigation at the bottom to toggle between months.
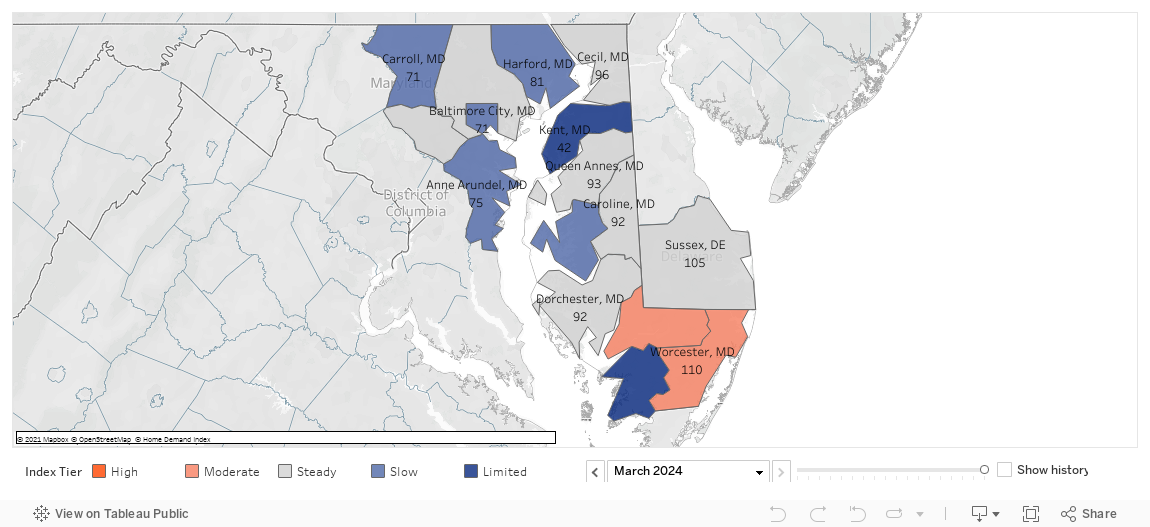
Baltimore Metro County-Level Market Trend Map | Home Demand Index
Current Market Report
Last 6 Market Reports
Historical Market Reports
Data Download
Baltimore | March 2024
Home Demand Index
Demand for homes in the Baltimore Metro area rose in February according to the Bright MLS | T3 Home Demand Index. The Index, at 80, was 15.9 percent higher over the month and reflected a Slow pace of buyer activity. Compared with one year earlier, the Index was 3.6 percent lower.
Buyer interest in all types of homes, except luxury condos, increased in February. The Index for luxury single-family homes rose the most, up by 48 percent over the month. Although down from the previous month, buyer interest in luxury condos remained stronger than any other segment with Moderate demand. Demand was weakest for entry-level and mid-market single-family homes, each with buyer interest in the Slow category. The inventory of homes available for sale remained relatively lean in February and was lower for each type of home over the month. The months supply ranged from 1.7 months for mid-market single-family homes to 3.2 months for luxury condos.
Monthly Statistics for March 2024
Home Demand
Index
Index
80
(Slow)
Home Demand Index
from prior month
from prior month
69
Home Demand Index
from prior year
from prior year
83
Index change
from prior month
from prior month
15.9%
Index change from
same time last year
same time last year
-3.6%
Bright MLS | T3 Home Demand Index
stage.homedemandindex.com
Baltimore | February 2024
Home Demand Index
The Bright MLS | T3 Home Demand Index for the Baltimore Metro area increased 19.6 percent to 67, a level consistent with Limited buyer demand. Buyer interest has been in the Limited range for 5 consecutive months. The Index was 16.3 percent lower than one year earlier.
Buyer interest in all types of Baltimore Metro area homes was higher in January. The Index for luxury condos increased the most, rising 75 percent to 119, a level of demand in the Moderate category. The Index was roughly one-fifth higher over the month for other market segments. Demand for condos in each price segment was stronger than other types of homes. Buyer interest in all types of single-family homes, which accounted for half of sales in January, was Limited. In fact, among all types of homes, demand was weakest for luxury single-family homes despite an uptick in demand over the month. The months supply rose for each type of home and ranged from 1.8 months for mid-market single-family homes to 4.6 months for luxury condos.
Monthly Statistics for February 2024
Home Demand
Index
Index
67
(Limited)
Home Demand Index
from prior month
from prior month
56
Home Demand Index
from prior year
from prior year
80
Index change
from prior month
from prior month
19.6%
Index change from
same time last year
same time last year
-16.3%
Bright MLS | T3 Home Demand Index
stage.homedemandindex.com
Baltimore | January 2024
Home Demand Index
The Bright MLS | T3 Home Demand Index for the Baltimore Metro area fell 17.9 percent in December to 55, a level consistent with Limited buyer demand. The Index was also in the Limited category in November and 12.7 percent lower than one year earlier.
The Bright MLS | T3 Home Demand Index for all types of homes decreased in December. The Index for luxury condos fell the most with a 31 percent drop followed by a 27 percent decrease for luxury single-family homes. Among the remaining home types, the Index fell by rates ranging from 13 percent to 21 percent over the month. Overall, buyer interest was in the Limited category for all types of homes except entry-level condos, which posted a Slow pace of buyer activity. The months supply of homes for sale was lower for most types of homes and ranged from 1.5 months for entry-level single-family homes to 4 months for luxury condos.
Monthly Statistics for January 2024
Home Demand
Index
Index
55
(Limited)
Home Demand Index
from prior month
from prior month
67
Home Demand Index
from prior year
from prior year
63
Index change
from prior month
from prior month
-17.9%
Index change from
same time last year
same time last year
-12.7%
Bright MLS | T3 Home Demand Index
stage.homedemandindex.com
Baltimore | December 2023
Home Demand Index
Demand for homes in the Baltimore Metro area decreased marginally in November according to the Bright MLS | T3 Home Demand Index. The Index, at 65, was 1.5 percent lower over the month and reflected a Limited pace of buyer activity. Compared with one year earlier, the Index was 16.7 percent lower.
Buyer interest in nearly all types of homes fell in November. In contrast to other segments of the metro market, the Index for townhouses rose slightly while the Index for luxury single-family homes fell 15 percent. Demand was strongest for luxury condos, which attracted a Steady level of buyer interest, followed by entry-level condos and townhouses each with Slow demand. Demand was weakest for entry-level and luxury single-family homes with buyer interest in the Limited range. The inventory of homes available for sale remained low in November. The months supply of luxury single-family homes decreased slightly and increased for all other types of homes, The months supply ranged from 1.9 months for entry-level and mid-market single-family homes to 3.3 months for luxury condos.
Monthly Statistics for December 2023
Home Demand
Index
Index
65
(Limited)
Home Demand Index
from prior month
from prior month
66
Home Demand Index
from prior year
from prior year
78
Index change
from prior month
from prior month
-1.5%
Index change from
same time last year
same time last year
-16.7%
Bright MLS | T3 Home Demand Index
stage.homedemandindex.com
Baltimore | November 2023
Home Demand Index
The Bright MLS | T3 Home Demand Index for the Baltimore Metro area increased 18.5 percent to 64, a level consistent with Limited buyer demand. The Index was 28.9 percent lower than one year earlier.
Buyer interest in most types of metro area homes was higher in October. The Index for entry-level condos increased the most, rising 41 percent to 83, a level of demand in the Slow category. Buyer interest was strongest for luxury condos, despite a slight decrease in the Index over the month. Demand was weakest for entry-level single-family homes, with the Index one-third lower than a year earlier. The inventory of homes for sale remained very lean with 3 months or less inventory among all types of homes. The months supply ranged from 1.6 months for entry-level single-family homes to 3 months for luxury single-family homes.
Monthly Statistics for November 2023
Home Demand
Index
Index
64
(Limited)
Home Demand Index
from prior month
from prior month
54
Home Demand Index
from prior year
from prior year
90
Index change
from prior month
from prior month
18.5%
Index change from
same time last year
same time last year
-28.9%
Bright MLS | T3 Home Demand Index
stage.homedemandindex.com
Baltimore | October 2023
Home Demand Index
The Bright MLS | T3 Home Demand Index for the Baltimore Metro area fell 39.5 percent in September to 52, a level consistent with Limited buyer demand. The Index was in the Slow category in August and 48.5 percent lower than one year earlier.
The Bright MLS | T3 Home Demand Index for all types of homes decreased in September. Demand for entry-level condos and townhouses fell by more than 40 percent over the month while the Index for other types of homes was down by somewhat less. Buyer interest in luxury condos was in the Steady category while demand for all other types of homes was in the Limited range. The months supply of homes for sale was higher for all types of homes over the month except condos. The months supply ranged from 1.3 months for entry-level condos to 3 months for luxury condos.
Monthly Statistics for October 2023
Home Demand
Index
Index
52
(Limited)
Home Demand Index
from prior month
from prior month
86
Home Demand Index
from prior year
from prior year
101
Index change
from prior month
from prior month
-39.5%
Index change from
same time last year
same time last year
-48.5%
Bright MLS | T3 Home Demand Index
stage.homedemandindex.com
Baltimore | September 2023
Home Demand Index
Demand for homes in the Baltimore Metro area decreased in August according to the Bright MLS | T3 Home Demand Index. The Index, at 84, was 4.5 percent lower over the month and reflected a Slow pace of buyer activity. Compared with one year earlier, the Index was 22.2 percent lower.
Buyer interest in most types of homes fell in August. The Index for luxury single-family homes decreased the most, falling by 18 percent, followed by a 9 percent decrease for mid-market single-family homes. Demand was strongest for luxury condos, which attracted a High level of buyer interest, followed by entry-level condos with Steady demand. Demand was weakest for entry-level single-family homes with buyer interest in the Limited range. The inventory of homes available for sale remained very low in August. The months supply ranged from 1.2 months for mid-market single-family homes to 3.5 months for luxury condos.
Monthly Statistics for September 2023
Home Demand
Index
Index
84
(Slow)
Home Demand Index
from prior month
from prior month
88
Home Demand Index
from prior year
from prior year
108
Index change
from prior month
from prior month
-4.5%
Index change from
same time last year
same time last year
-22.2%
Bright MLS | T3 Home Demand Index
stage.homedemandindex.com
All reports for the Baltimore Market Area.
List of available data files. Note that the data file includes all data for the report period across the entire Bright MLS footprint.