Philadelphia Metro
Metro Area Overview
Market Trend Map
Metro Area Overview
The Bright MLS | T3 Home Demand Index for the Philadelphia Metro area rose 15.2 percent in February to 76, a level consistent with Slow buyer demand. The Index was in the Limited category in January and 3.8 percent lower than one year earlier.
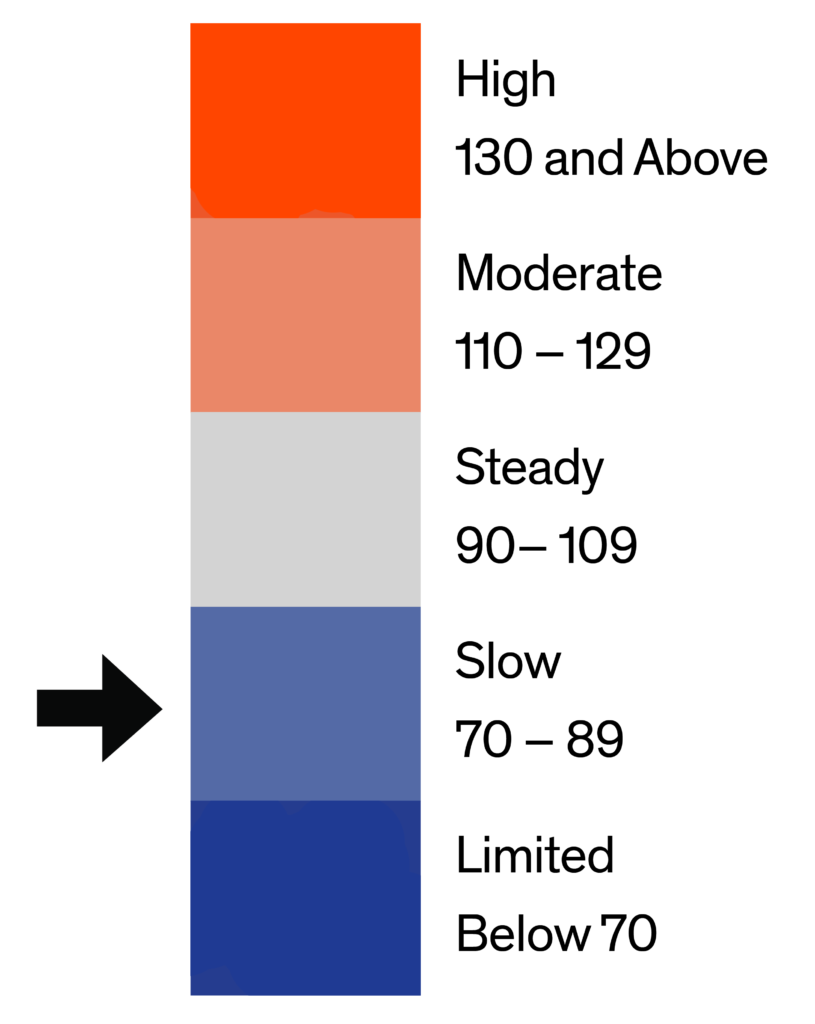
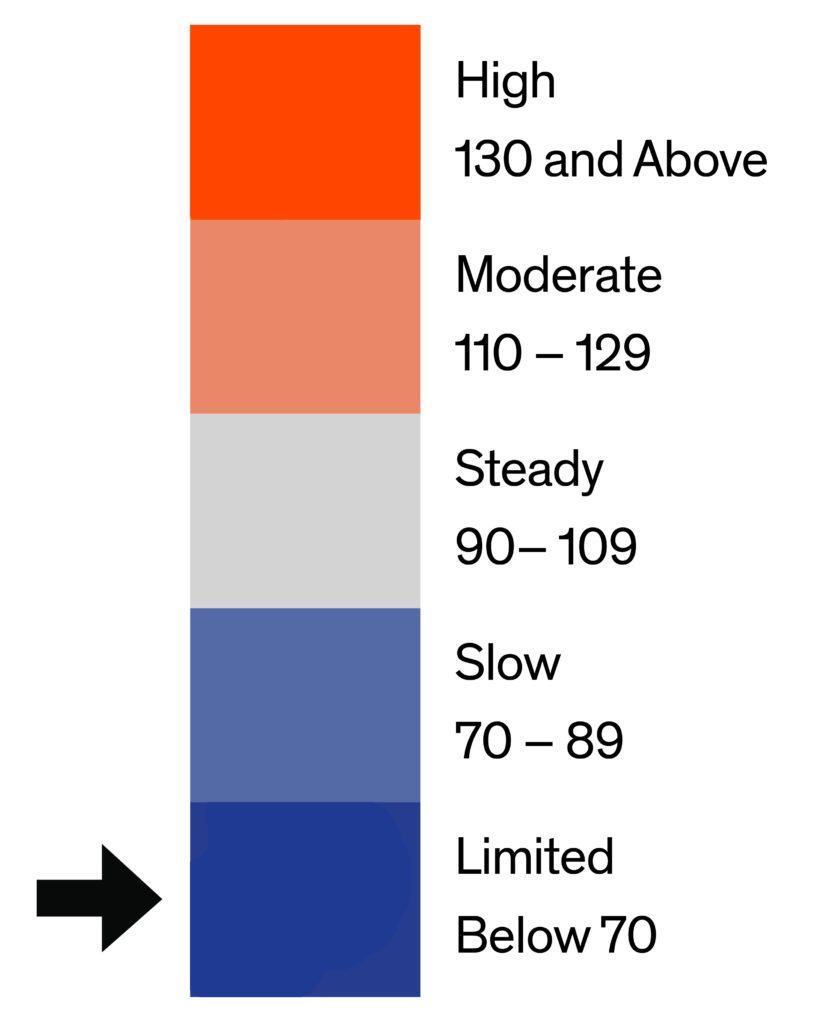
The market trend line, below, provides a high-level monthly overview of the Home Demand Index for each of the metro market areas within the Greater Philadelphia Metro Area. The Home Demand Index is baselined at 100, with 90-110 indicating a steady market. Index values above 110 indicate moderate and high activity while Index values below 90 indicate slower or limited activity. For more information for a given period of time, click on any point on the map to pull up the monthly report.

Metro Market Trend Data by Bright MLS | T3 Home Demand Index
Each of the market areas listed above are defined as follows:
- Central Pennsylvania – Adams, PA; Berks, PA; Cumberland, PA; Dauphin, PA; Franklin, PA; Fulton, PA; Lancaster, PA; Lebanon, PA; Perry, PA; Schuylkill, PA; York, PA;
- Ocean County – Ocean, NJ;
- Philadelphia Metro – Bucks, PA; Burlington, NJ; Camden, NJ; Chester, PA; Delaware, PA; Gloucester, NJ; Kent, DE; Mercer, NJ; Montgomery, PA; New Castle, DE; Philadelphia, PA;
- Salem-Cumberland – Cumberland, NJ; Salem, NJ;
Market Trend Map
The Market Trend Map for the Philadelphia Metro pulls the county map from the monthly reports and combines to provide a time-lapse of the overall market. Use the navigation at the bottom to toggle between months.
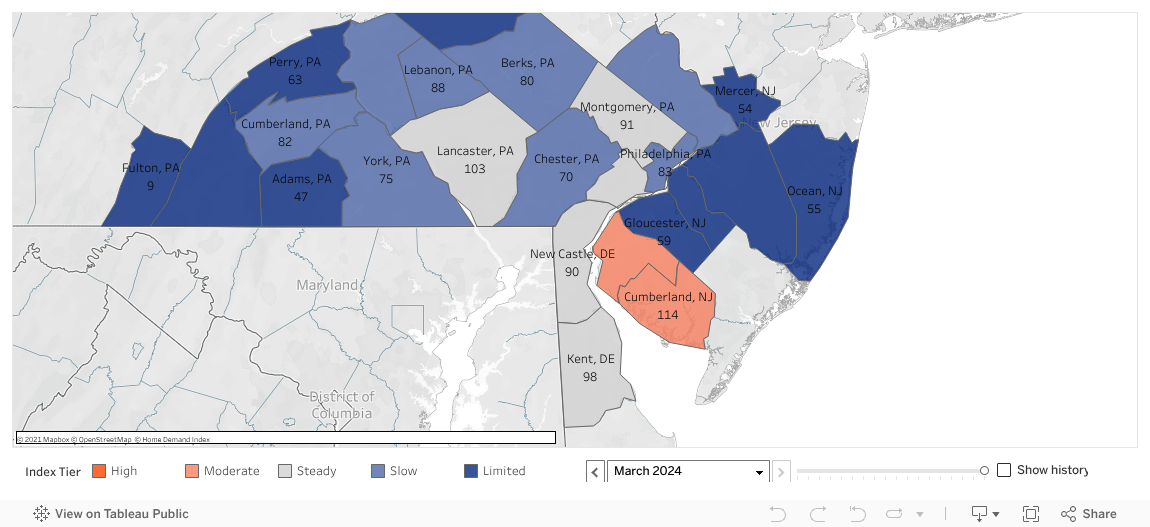
Philadelphia Metro County-Level Market Trend Map | Home Demand Index
Current Market Report
Last 6 Market Reports
Historical Market Reports
Data Download
Philadelphia | March 2024
Home Demand Index
The Bright MLS | T3 Home Demand Index for the Philadelphia Metro area rose 15.2 percent in February to 76, a level consistent with Slow buyer demand. The Index was in the Limited category in January and 3.8 percent lower than one year earlier.
The Bright MLS | T3 Home Demand Index for all types of homes was unchanged or higher over the month. Demand for luxury single-family homes rose the most with an increase of 35 percent over the month. Buyer interest in entry-level condos was unchanged in February. Demand for luxury condos was stronger than any other type of home. In contrast, buyer interest in luxury single-family homes was softer than any other segment with the Index in the Limited category. The months supply of homes for sale was somewhat lower for each type of condo, and marginally higher for all other segments. The months supply ranged from 2.1 months for mid-market single-family homes to 7 months for luxury condos.
Monthly Statistics for March 2024
Home Demand
Index
Index
76
(Slow)
Home Demand Index
from prior month
from prior month
66
Home Demand Index
from prior year
from prior year
79
Index change
from prior month
from prior month
15.2%
Index change from
same time last year
same time last year
-3.8%
Bright MLS | T3 Home Demand Index
stage.homedemandindex.com
Philadelphia | February 2024
Home Demand Index
Demand for homes in the Philadelphia Metro area rose in January according to the Bright MLS | T3 Home Demand Index. The Index, at 65, was 30 percent higher over the month and reflected a Limited pace of buyer activity. Compared with one year earlier, the Index was 13.3 percent lower.
Buyer interest in all types of homes rose in January. The Index for luxury condos increased the most, rising by 75 percent, followed by a 40 percent rise for entry-level condos and luxury single-family homes. Demand was strongest for luxury condos, which attracted a Steady level of buyer interest, followed by entry-level condos with Slow demand. Demand was weakest for luxury single-family homes with buyer interest in the Limited range. The months supply increased for all types of homes except luxury condos. The months supply ranged from 2 months for mid-market single-family homes to 9.5 months for luxury condos.
Monthly Statistics for February 2024
Home Demand
Index
Index
65
(Limited)
Home Demand Index
from prior month
from prior month
50
Home Demand Index
from prior year
from prior year
75
Index change
from prior month
from prior month
30%
Index change from
same time last year
same time last year
-13.3%
Bright MLS | T3 Home Demand Index
stage.homedemandindex.com
Philadelphia | January 2024
Home Demand Index
The Bright MLS | T3 Home Demand Index for the Philadelphia Metro area decreased 23.4 percent to 49, a level consistent with Limited buyer demand. Demand has been in the Limited category for 4 consecutive months. The Index was 14 percent lower than one year earlier.
Demand for all types of Philadelphia Metro area homes was lower in December. The Index for luxury single-family homes decreased the most, falling 41 percent to 29, a level of demand in the Limited category. Buyer interest was strongest for entry-level condos but was nevertheless still in the Limited category. In addition to falling the most, demand was weakest for luxury single-family homes. The months supply rose for each type of condo and decreased among the remaining segments. The months supply ranged from 1.6 months for mid-market single-family homes to 9.9 months for luxury condos.
Monthly Statistics for January 2024
Home Demand
Index
Index
49
(Limited)
Home Demand Index
from prior month
from prior month
64
Home Demand Index
from prior year
from prior year
57
Index change
from prior month
from prior month
-23.4%
Index change from
same time last year
same time last year
-14%
Bright MLS | T3 Home Demand Index
stage.homedemandindex.com
Philadelphia | December 2023
Home Demand Index
The Bright MLS | T3 Home Demand Index for the Philadelphia Metro area fell 3.1 percent in November to 63, a level consistent with Limited buyer demand. The Index has been in the Limited category for the past three months. Compared with one year earlier, the Index was 17.1 percent lower.
The Bright MLS | T3 Home Demand Index for entry-level single-family homes and entry-level condos rose marginally over the month. Demand for all other types of homes was lower compared with October. Buyer interest in luxury single-family homes fell the most with the Index down by 15 percent over the month. Demand in each condo segment was in the Slow range while buyer interest was Limited for each of the remaining types of homes. The months supply of entry-level and luxury condos fell in November while supply conditions eased somewhat for other types of homes. The months supply ranged from 1.8 months for mid-market single-family homes to 6.5 months for luxury condos.
Monthly Statistics for December 2023
Home Demand
Index
Index
63
(Limited)
Home Demand Index
from prior month
from prior month
65
Home Demand Index
from prior year
from prior year
76
Index change
from prior month
from prior month
-3.1%
Index change from
same time last year
same time last year
-17.1%
Bright MLS | T3 Home Demand Index
stage.homedemandindex.com
Philadelphia | November 2023
Home Demand Index
Demand for homes in the Philadelphia Metro area rose in October according to the Bright MLS | T3 Home Demand Index. The Index, at 64, was 28 percent higher over the month and reflected a Limited pace of buyer activity. Compared with one year earlier, the Index was 26.4 percent lower.
Buyer interest in most types of homes rose in October. The Index for entry-level single-family homes increased the most, rising by 50 percent, followed by a 40 percent rise for entry-level condos. The Index was marginally lower for luxury condos although demand was stronger than any other segment of the metro area market. The Index was lowest for mid-market and luxury single-family homes with buyer interest in the Limited range. The inventory of homes available for sale remained relatively low in October although the months supply rose for all types of homes. The months supply ranged from 1.7 months for mid-market single-family homes to 8 months for luxury condos.
Monthly Statistics for November 2023
Home Demand
Index
Index
64
(Limited)
Home Demand Index
from prior month
from prior month
50
Home Demand Index
from prior year
from prior year
87
Index change
from prior month
from prior month
28%
Index change from
same time last year
same time last year
-26.4%
Bright MLS | T3 Home Demand Index
stage.homedemandindex.com
Philadelphia | October 2023
Home Demand Index
The Bright MLS | T3 Home Demand Index for the Philadelphia Metro area decreased 42.4 percent to 49 in September, a level consistent with Limited buyer demand. Demand was in the Slow range in August. The Index was 49.5 percent lower than one year earlier.
Buyer interest in all types of Philadelphia Metro area homes was significantly lower in September. The Index for entry-level single-family homes fell by more than half over the month while buyer interest in other market segments was down only somewhat less. Buyer interest was strongest for luxury condos, with Slow demand, while all other types of homes attracted Limited buyer activity. The months supply rose for each market segment reflecting generally lower sales paired with little change in the number of listings for sale. The months supply ranged from 1.5 months for mid-market single-family homes to 5.2 months for luxury condos.
Monthly Statistics for October 2023
Home Demand
Index
Index
49
(Limited)
Home Demand Index
from prior month
from prior month
85
Home Demand Index
from prior year
from prior year
97
Index change
from prior month
from prior month
-42.4%
Index change from
same time last year
same time last year
-49.5%
Bright MLS | T3 Home Demand Index
stage.homedemandindex.com
Philadelphia | September 2023
Home Demand Index
The Bright MLS | T3 Home Demand Index for the Philadelphia Metro area fell 2.3 percent in August to 84 and remained in the Slow buyer demand category. The Index was 16.8 percent lower than one year earlier.
The Bright MLS | T3 Home Demand Index reflected generally weaker buyer activity among all types of homes in August. Demand for luxury single-family homes fell the most with a 10 percent drop in the Index. The Index for entry-level single-family homes was unchanged while demand among the remaining market segments was marginally lower. Buyer interest in luxury condos and townhouses was in the Steady category while demand for all other types of homes was in the Slow range. The months supply was lower for each type of home ranging from 1.2 months for mid-market single-family homes to 5.2 months for luxury condos.
Monthly Statistics for September 2023
Home Demand
Index
Index
84
(Slow)
Home Demand Index
from prior month
from prior month
86
Home Demand Index
from prior year
from prior year
101
Index change
from prior month
from prior month
-2.3%
Index change from
same time last year
same time last year
-16.8%
Bright MLS | T3 Home Demand Index
stage.homedemandindex.com
All reports for the Philadelphia Market Area.
List of available data files. Note that the data file includes all data for the report period across the entire Bright MLS footprint.