Washington D.C. Metro
Metro Area Overview
Market Trend Map
Metro Area Overview
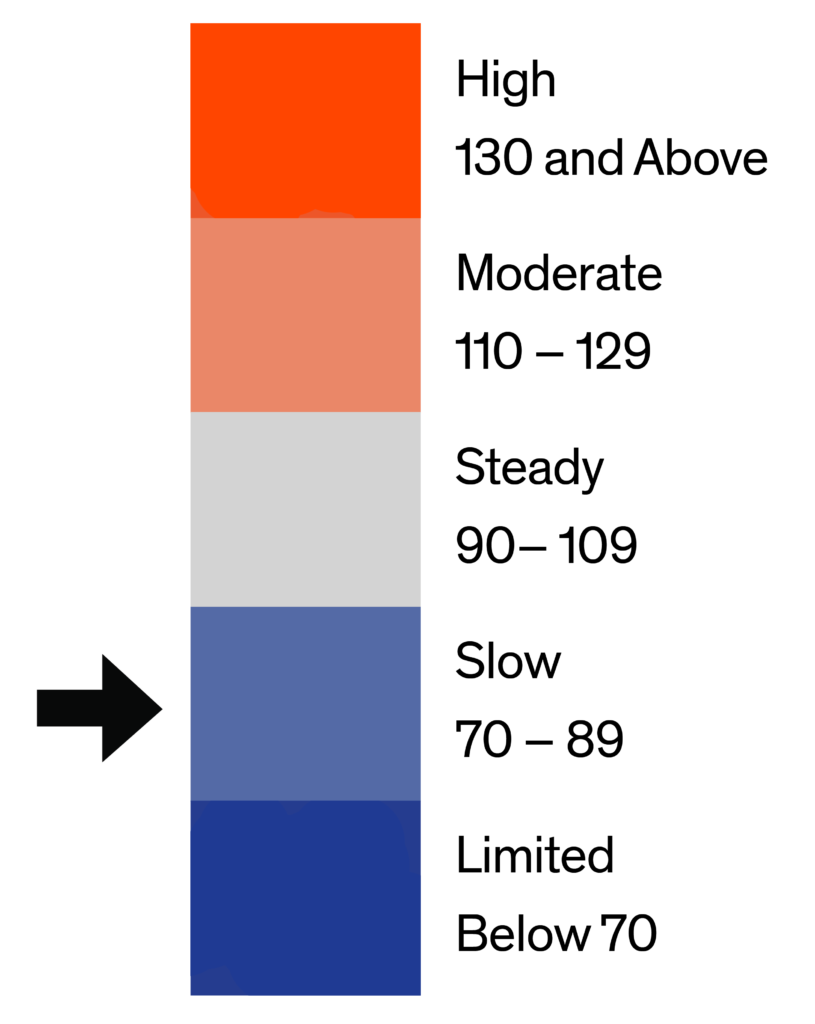
The Bright MLS | T3 Home Demand Index for the Washington Metro area increased 14.1 percent to 73, a level consistent with Slow buyer demand. Demand was in the Limited range in January. The Index was 5.2 percent lower than one year earlier.
The market trend line, below, provides a high-level monthly overview of the Home Demand Index for each of the metro market areas within the Greater Washington D.C. Metro Area. The Home Demand Index is baselined at 100, with 90-110 indicating a steady market. Index values above 110 indicate moderate and high activity while Index values below 90 indicate slower or limited activity. For more information for a given period of time, click on any point on the map to pull up the monthly report.

Metro Market Trend Data by Bright MLS | T3 Home Demand Index
Each of the market areas listed above are defined as follows:
- Maryland-West Virginia Panhandle – Allegany, MD; Berkeley, WV; Garrett, MD; Grant, WV; Hampshire, WV; Hardy, WV; Jefferson, WV; Mineral, WV; Morgan, WV; Pendleton, WV; Washington, MD;
- North Central Virginia – Caroline, VA; Clarke, VA; Culpeper, VA; Fauquier, VA; Frederick, VA; Fredericksburg City, VA; King George, VA; Madison, VA; Manassas City, VA; Orange, VA; Page, VA; Prince William, VA; Rappahannock, VA; Shenandoah, VA; Spotsylvania, VA; Stafford, VA; Warren, VA; Winchester City, VA;
- Southern Maryland – Calvert, MD; Charles, MD; Saint Marys, MD;
- Washington D.C. Metro – Alexandria City, VA; Arlington, VA; Fairfax, VA; Falls Church City, VA; Frederick, MD; Loudoun, VA; Montgomery, MD; Prince Georges, MD; Washington, DC;
Market Trend Map
The Market Trend Map for the Washington D.C. Metro pulls the county map from the monthly reports and combines to provide a time-lapse of the overall market. Use the navigation at the bottom to toggle between months.

Washington D.C. Metro County-Level Market Trend Map | Home Demand Index
Current Market Report
Last 6 Market Reports
Historical Market Reports
Data Download
Washington D.C. | March 2024
Home Demand Index
The Bright MLS | T3 Home Demand Index for the Washington Metro area increased 14.1 percent to 73, a level consistent with Slow buyer demand. Demand was in the Limited range in January. The Index was 5.2 percent lower than one year earlier.
Buyer interest in all types of Washington Metro area homes was unchanged or higher in February. The Index for luxury single-family homes increased the most, rising 40 percent. Buyer interest was strongest for luxury condos, which attracted a Moderate level of demand, followed by luxury single-family homes with Steady buyer interest. Demand was weakest for entry-level and mid-market single-family homes, each with Limited buyer interest. The months supply ranged from 1.5 months for mid-market single-family homes to 3.9 months for luxury condos.
Monthly Statistics for March 2024
Home Demand
Index
Index
73
(Slow)
Home Demand Index
from prior month
from prior month
64
Home Demand Index
from prior year
from prior year
77
Index change
from prior month
from prior month
14.1%
Index change from
same time last year
same time last year
-5.2%
Bright MLS | T3 Home Demand Index
stage.homedemandindex.com
Washington D.C. | February 2024
Home Demand Index
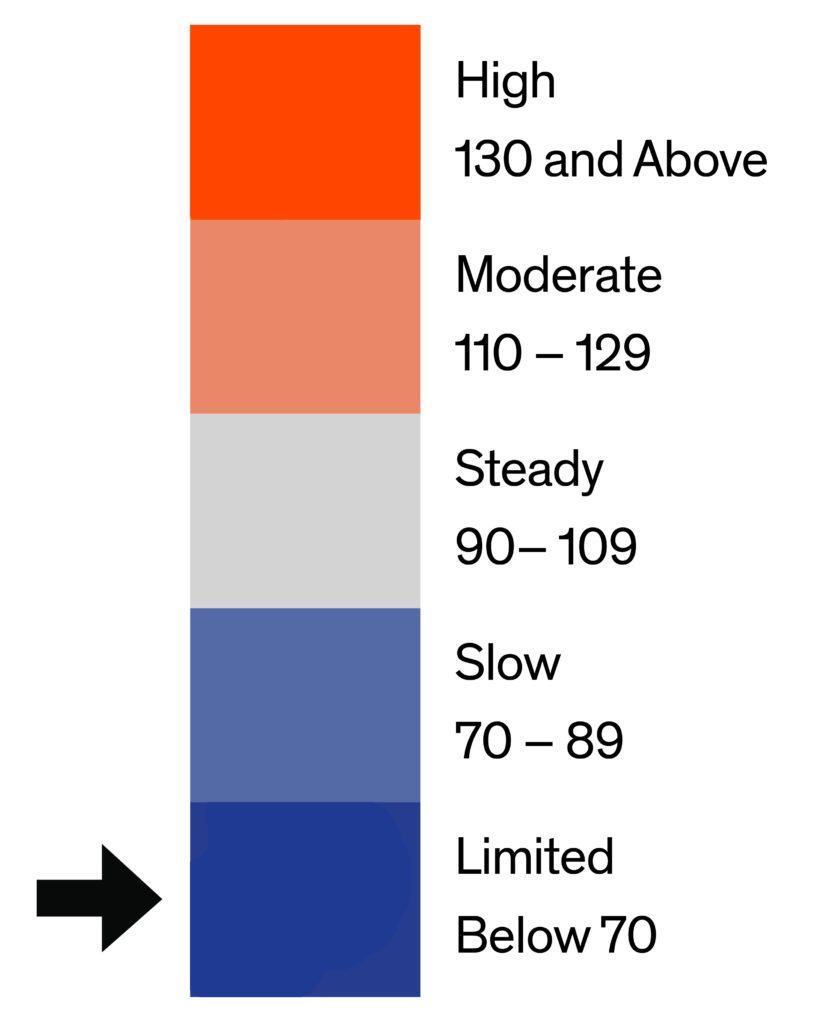
The Bright MLS | T3 Home Demand Index for the Washington Metro area rose 32.6 percent in January to 61, a level consistent with Limited buyer demand. The Index was 18.7 percent lower than one year earlier.
The Bright MLS | T3 Home Demand Index for all types of homes increased in January. Demand for luxury condos rose 64 percent followed by a 57 percent increase for luxury single-family homes. Buyer interest was strongest for condos with demand for entry-level condos in the Slow range and luxury condo demand in the Steady category. Demand was Limited in all other segments of the metro area market. The months supply of homes for sale was higher for all types of homes except luxury condos, which was marginally lower. The months supply ranged from 1.7 months for mid-market single-family homes to 3.7 months for luxury condos.
Monthly Statistics for February 2024
Home Demand
Index
Index
61
(Limited)
Home Demand Index
from prior month
from prior month
46
Home Demand Index
from prior year
from prior year
75
Index change
from prior month
from prior month
32.6%
Index change from
same time last year
same time last year
-18.7%
Bright MLS | T3 Home Demand Index
stage.homedemandindex.com
Washington D.C. | January 2024
Home Demand Index
Demand for homes in the Washington Metro area fell in December according to the Bright MLS | T3 Home Demand Index. The Index, at 45, was 21.1 percent lower over the month and reflected a Limited pace of buyer activity. Compared with one year earlier, the Index was 21.1 percent lower.
Buyer interest in all types of homes fell in December. The Index for luxury single-family homes decreased the most, falling by 35 percent, followed by a 27 percent decline for mid-market single-family homes. Demand was strongest for homes in each condo segment although still attracting only Limited buyer interest. Activity was weakest for mid-market single-family homes. The inventory of homes available for sale remained lean while the months supply decreased for all types of homes. The months supply ranged from 1.5 months for mid-market single-family homes to 3.8 months for luxury condos.
Monthly Statistics for January 2024
Home Demand
Index
Index
45
(Limited)
Home Demand Index
from prior month
from prior month
57
Home Demand Index
from prior year
from prior year
57
Index change
from prior month
from prior month
-21.1%
Index change from
same time last year
same time last year
-21.1%
Bright MLS | T3 Home Demand Index
stage.homedemandindex.com
Washington D.C. | December 2023
Home Demand Index
The Bright MLS | T3 Home Demand Index for the Washington Metro area decreased 3.4 percent to 56, a level signaling continued Limited buyer demand. The Index was 26.3 percent lower than one year earlier.
While demand for entry-level single-family homes rose slightly in November, buyer interest in all other types of homes across the Washington Metro area decreased. The Index for luxury condos and luxury single-family homes fell the most, down by 23 percent and 14 percent, respectively. Despite the decrease in November, buyer interest was strongest for luxury condos, which attracted Slow demand, followed by entry-level condos with Limited buyer interest. Demand was weakest for mid-market single-family homes. The months supply was flat or somewhat higher for all types of homes except luxury condos. The available inventory ranged from 1.8 months supply for mid-market single-family homes to 4.1 months supply for luxury condos.
Monthly Statistics for December 2023
Home Demand
Index
Index
56
(Limited)
Home Demand Index
from prior month
from prior month
58
Home Demand Index
from prior year
from prior year
76
Index change
from prior month
from prior month
-3.4%
Index change from
same time last year
same time last year
-26.3%
Bright MLS | T3 Home Demand Index
stage.homedemandindex.com
Washington D.C. | November 2023
Home Demand Index
The Bright MLS | T3 Home Demand Index for the Washington Metro area rose 14 percent in October to 57, a level consistent with Limited buyer demand. The Index was 37.4 percent lower than one year earlier.
The Bright MLS | T3 Home Demand Index for all types of homes, except luxury condos, rose in October. The Index was up 16 percent for entry-level single-family homes and by a somewhat smaller percentage for mid-market single-family homes, entry-level condos and townhouses. Demand for luxury condos was down slightly. Buyer interest was strongest for luxury condos and weakest for entry level and mid-market single-family homes. The months supply of homes for sale was higher for each type of home. The available inventory ranged from 1.8 months supply for mid-market single-family homes to 4.6 months for luxury condos.
Monthly Statistics for November 2023
Home Demand
Index
Index
57
(Limited)
Home Demand Index
from prior month
from prior month
50
Home Demand Index
from prior year
from prior year
91
Index change
from prior month
from prior month
14%
Index change from
same time last year
same time last year
-37.4%
Bright MLS | T3 Home Demand Index
stage.homedemandindex.com
Washington D.C. | October 2023
Home Demand Index
Demand for homes in the Washington Metro area fell in September according to the Bright MLS | T3 Home Demand Index. The Index, at 48, was 37.7 percent lower over the month and reflected a Limited pace of buyer activity. Compared with one year earlier, the Index was 54.7 percent lower.
Buyer interest in all types of homes fell in September. The Index for entry-level single-family homes and entry-level condos was roughly 40 percent lower while buyer interest in other segments fell somewhat less. Demand was strongest for luxury condos, which attracted a Steady level of buyer interest, while demand for all other types of homes was in the Limited range. The inventory of homes available for sale remained low with less than a two months supply in each segment except luxury single-family homes and luxury condos. The months supply was generally higher in September and ranged from 1.6 months for mid-market single-family homes to 3.6 months for luxury condos.
Monthly Statistics for October 2023
Home Demand
Index
Index
48
(Limited)
Home Demand Index
from prior month
from prior month
77
Home Demand Index
from prior year
from prior year
106
Index change
from prior month
from prior month
-37.7%
Index change from
same time last year
same time last year
-54.7%
Bright MLS | T3 Home Demand Index
stage.homedemandindex.com
Washington D.C. | September 2023
Home Demand Index
The Bright MLS | T3 Home Demand Index for the Washington Metro area decreased 10.7 percent to 75, a level consistent with Slow buyer demand. The Index was 25.7 percent lower than one year earlier.
Buyer interest in all types of Washington Metro area homes was lower in August. The Index for luxury condos decreased the most, falling 19 percent to 109, but was still higher than any other segment despite the decrease over the month. Demand was weakest for entry-level and mid-market single-family homes, both in the Limited demand category. The inventory of homes for sale remained very lean with less than two months supply for all types of homes except luxury condos. The months supply ranged from 1.3 months for mid-market single-family to 2.9 months for luxury condos.
Monthly Statistics for September 2023
Home Demand
Index
Index
75
(Slow)
Home Demand Index
from prior month
from prior month
84
Home Demand Index
from prior year
from prior year
101
Index change
from prior month
from prior month
-10.7%
Index change from
same time last year
same time last year
-25.7%
Bright MLS | T3 Home Demand Index
stage.homedemandindex.com
All reports for the Washington D.C. Market Area.
List of available data files. Note that the data file includes all data for the report period across the entire Bright MLS footprint.